

What are Tenant Satisfaction Measures?
In April 2023, Tenant Satisfaction Measures (TSMs) were brought in by the Regulator of Social Housing. They’re a way of comparing how landlords across the country are performing and to make sure that good quality homes and services are being provided. They also mean landlords and social housing providers like us can be held to account when they need to do better for their customers.
The survey's different from the ones we do after you've had a repair for example, they’re all about how you feel we’re doing in general. It helps us to see what matters most to you and what we can improve on.
Where our scores are low or we know something's really important to you, we're developing action plans for improvements. We put them together by looking at the feedback we got from the survey, the scores themselves, and the feedback you give us after we provide you with a service. We put this alongside what our customer groups tell us and what our colleagues tell us are their biggest challenges too.
Take a look at this year’s results, and how they compare to last year’s. To find out how we collected the data and what changes we’re making, head to our FAQs.
Overall satisfaction, listening to your views and keeping you informed
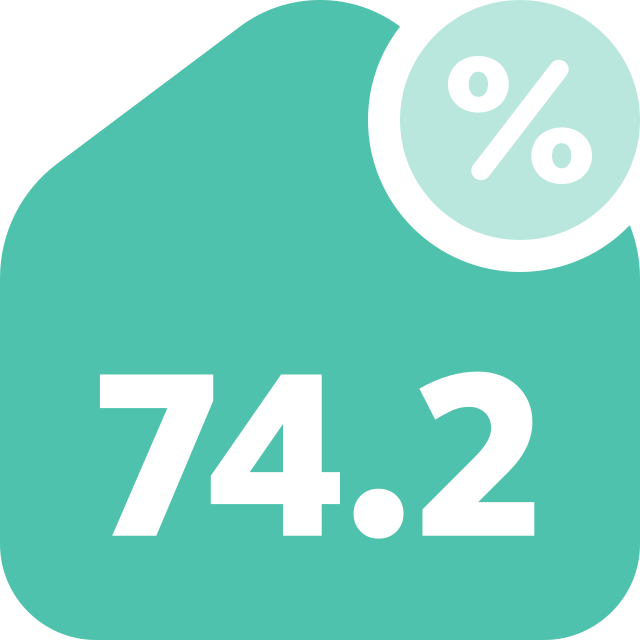
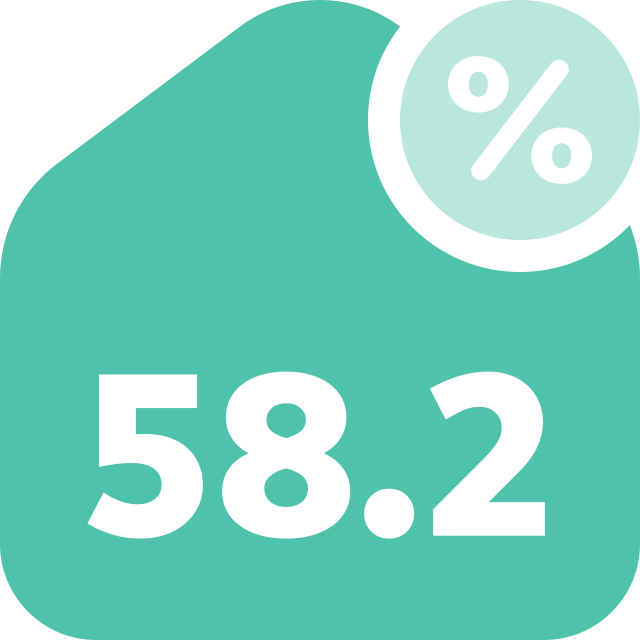
Our overall customer satisfaction score is 74% for our rental customers and 58% for our homeownership customers. That's an 8% improvement for our rental customers and just over 3% for our homeownership customers.
We know that some changes we made last year have improved how you've scored us and there are still some areas we need to work on. The feedback you give us helps to shape our services and means we know we're making the right changes, the ones you've told us you want to see.
You've told us we need to listen to you and make changes based on what you tell us. We've worked with you on shaping how our portal works, we've listened to feedback and reintroduced housing officers and managers, and you helped us update our repairs policy.
Our overall satisfaction scores have gone up but we're focusing on fixing what you told us you weren't satisfied with. What came through was frustration around delays and missed appointments for your repairs and their quality.
You also told us we need to do a better job of handling complaints and antisocial behaviour issues and keeping you informed when you've got anything outstanding with us. We now make sure you hear from us at least every two weeks when you have an outstanding antisocial behaviour case with us and for our complaints we'll resolve in an average of 10 working days.
What else changed?
We’ve been busy making sure we’re fixing your repairs more quickly. By the end of March 2026 we were fixing your repair 9 days quicker (on average) compared to April 2025. We’ve chosen those dates because that matches up with the timeframe for the TSMs.
We've used data and local insight to create personalised place plans for each area (more on that later). We've upgraded our customer portal and changed how our repairs team works to make sure you get a better experience.
We're focusing on what you've told us really matters to you, which is that we listen to your views and act on them, and make sure that your home is well-maintained.
You scored us lowest in our approach to complaints handling (43.1%) and our approach to handling antisocial behaviour (54.9%) You'll find more about what we're doing to improve all these areas in our action plans.
Our safety check results
99.9%
BS01: Gas safety checks
99.9%
BS02: Fire safety checks
100%
BS03: Asbestos safety checks
98.9%
BS04: Water safety checks
99.8%
BS05: Lift safety checks
These figures show the percentage of our homes that have had the relevant safety checks at the end of March 2026.
Our action plans
We've got plans in place for improvements this year.
Changes you'll be seeing:
Action plans

FAQs
We gathered survey responses between April 2025 and March 2026. A huge thank you to the 2,218 customers that completed the survey (1,893 from our low-cost rental customers and 325 from our low-cost homeownership customers)!
We worked with MEL Research, who conducted the surveys via email links and phone on our behalf.
For our low cost rental customers, 43% completed the survey online and 57% on the phone. For our low cost homeownership customers, 55% completed the survey online and 45% on the phone.
The Regulator of Social Housing sets out the questions we have to ask our customers, for both low cost rental and low cost home ownership customers. We could put our own introduction in so we've included that in the attachment below too.
The results of the survey are submitted to the Regulator of Social Housing and must represent who our customers are and the homes they live in, or the data must be weighted so that it is. Our data accurately represented our customers when we considered characteristics such as the representation of flats and homes, customer age, ethnicity, building type and geographical area. This meant we didn’t have to apply any weighting to the data.
We’ve got loads of changes happening this year that will improve your customer experience, especially around what really matters to you. You can find out all the details over on our action plan page.
We divided our customer base into subgroups based on stock type, age, ethnicity, building type and local authority and gave MEL Research a list of all customers eligible to be surveyed each month to sample from.
Where next?
Use these quick links to the side to explore more of the Tenant Satisfaction Measures or head back to the customer homepage.